vROps 7.5 Create SuperMetric Helper


I have been hearing back from customers about our vast Operations Profile that includes vRealize Operations Manager (vROps), Wavefront, and Cloud Health.
These products have a lot of overlapping features, but together they provide a holistic solution. So why do we need three products to produce a comprehensive solution for Operations?
I can use a couple of buzz words here “Persona,” ” Focus Lens,” Etc but let’s state it as merely Cloud Admins Teams, Application Teams, and C level teams need to view and consume data differently.
vROps is the tool every Cloud Admin needs, and it provides deep analytics, infrastructure costing, capacity planning, alerting, performance troubleshooting for your private cloud. You can use vROPS for some application data, but that data is driven from an infrastructure point of view. The vROps lense is infrastructure focus looking up at the application.
So how do I gather data and provide analytics for my applications that are part of my multi-cloud initiative?
Wavefront will provide analytic data for cross clouds gathering data that can be analyzed and correlated each second to help troubleshoot performance gaps in applications. Sounds great! Why do I need vROps?
Wavefront gathers data at the application level and looks down the stack to infrastructure, the view down into infrastructure with data that derived from an application point of view would not tell you the full story of what is happening in the infrastructure.
What about costs for multiple clouds with a full cost structure for C-Level Teams?
Cloud Health can deliver full cost insight to multiple public clouds like AWS, Azure, GPC, VMC and private clouds. Cloud Health includes optimation, rightsizing to help trim spending waste in the public cloud and private clouds alike. The costing data is immersive with spend tracking and budget reporting.
So why would still need to do costing with vROps?
Cloud Health’s focus on costing metrics at the C-Level/Accounting level, where vROps can provide more of department level show back, chargeback model for private cloud and few public clouds like AWS and Azure.
So three key takeaways are:
vROps –> Infrastructure Operations/Analytics and Costing
WaveFront –> Application Analytics for multi-cloud
CloudHealth –> Multi-cloud C-Level costing
vRealize Operations Manager (vROps) helps customers identify and remediate performance issues, alert management, capacity, and cost.
Please see the great work that commuinity is working to create vROps dashboard repositiory for customers. These Dashboards are created by some of the experts in the field so go and check them out!!


I started to test the vROps CLI that was created by Blue Medora, with the use case of gathering information for documentation and the ability to do things programmatically in the future.
The first thing you will have to do is download the correct file:
Copy the file to folder location like vROpsCLI there should be two files CLI executable and examples.vropscli.yml. You will need to edit the examples.vropscli.yml to point to your vROps instance and give local credentials with access. Here is an example of examples.vropscli.yml file:
default:
host: “192.168.1.1”
user: “vropsuser”
pass: “password”
Now you can kick off vropscli file here is a list of the different commands:

As you can see, there is a lot of flexibility from “get” commands for gathering information to creating alerts or updating vROps. I will focus on a few of the “get” commands for quick documentation.
./vropscli getVropsLicense You can pipe each command to *.CSV for readability ./vropscli getVropsLicense >vROps_LicenseKey.csv

./vropscli getAdapters this will list the adapters for this vROps instance allowing us to document them and then use the UUID’s for other commands.
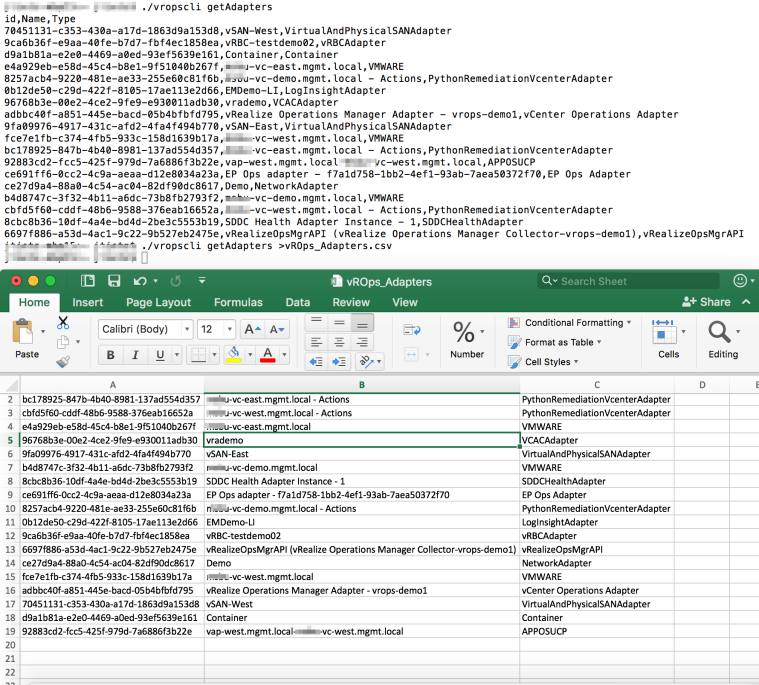
Example is:
./vropscli getAdapterConfig –adapterId fce7e1fb-c374-4fb5-933c-158d1639b17a
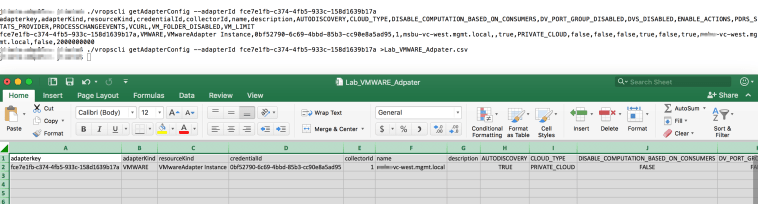
A couple of items here I found interesting the Cloud_TYPE field is set to Privite_Cloud this tells me in future versions will have support for different type clouds most likely round costing functionality that is new to vROps 6.7. VM_LIMIT is set 2 million by default, I find that interesting and would to hear from anyone pushing that limit.
I had this conversation with many customers over the years that vROps metrics are only as good as the metrics collected and logic applied by vROps.
Recently until VMware tools 10.3, vROps 6.7 was heavily using the following two metrics for memory – consumed and active.
The nature of memory consumed metric is such that if a VM requested memory from the hypervisor the value of this metric will increase. However, it is difficult for the hypervisor to know when to free host physical memory upon virtual machine memory deallocation because guest operating system free list is generally is not publicly accessible. So in practice, the value memory consumed metric very often reaches close to 100%, and it doesn’t decrease even when later VM becomes idle.
Why this happening is because some operating systems tend to assign the entire amount of memory they see in the “machine” for various kind of caches to get the best possible performance. Some database and similar workloads tend to grab as much memory as they can get so they can use large buffers and do most of their work in memory.
While the “active” memory is an estimation by VMKernel based on recently touched memory pages. The purpose of this metric is to ensure that in case of memory overcommitment the hypervisor gives the host memory to the active guest memory as much as possible.
Memory overcommitment allows the hypervisor to use memory reclamation techniques to take the inactive or unused host physical memory away from the idle virtual machines and give it to other virtual machines that will actively use it. Otherwise, without having a counter like “active,” it would not have been possible to support memory overcommitment if the hypervisor cannot reclaim the host physical memory upon virtual machine memory deallocation.
However, the value of this metric is different from what the guest operating system reports, because it is an estimation counted based on whether pages are touched or not within the sampling interval. If the Guest OS has acquired the memory but is not actively touching those may see much lower value than what you see inside the guest. So only by looking inside the guest, it is possible to understand how much of its memory currently used.
Therefore in 6.7 release, the implementation of Memory|Usage% metric was changed to rely on a new metric Memory|Utilization (KB) which considers usage from Guest OS perspective and not from a hypervisor perspective.
This new Memory|Utilization (KB) metric implemented for the new capacity engine, and it was relying on Guest OS memNeeded metric, however, if Guest OS data was not available, then it was falling back to hypervisor’s memory Consumed metric.
Caused a behavioral change from Memory|Usage% perspective in a case when guest data was not available; it started to show the value of memory consumed metric while in previous versions Memory|Usage% was using the Active memory metric of the hypervisor.
From the vROps side we are going to change the implementation of memory usage metric:
1. Memory|Usage(%) – calculate based on the guest metrics (Guest|Needed Memory(KB)) or fallback to vCenter provided mem.usage.average that based on active memory if guest metrics are not available
a. Using guest metrics if available. Otherwise, we restore the behavior that was before 6.7
However, keeping the existing formula of Memory|Utilization (KB) as it is:
2. Memory|Utilization(KB) – leave this metric as is, i. e. calculated based on the guest metrics or fallback to Memory|Consumed(KB) if guest metrics are not available. Capacity planning, WLP, Cost calculation, What-If all are based on this metric.
Although using Memory|Consumed for those engines is quite conservative, but at least it’s safe unlike using Active Memory or Demand (that is based Active Memory as well) that can potentially lead to wrong recommendations.
a. So in case when Guest metrics are not available, virtual machine capacity-related metrics for memory will be calculated based on the consumed metric. If the guest metrics are not available the behavior will be very conservative. This method will be much safer from Capacity Planning, WLP, and What-If perspective when deciding if a VM can fit in the target cluster or not. Rightsizing will not be as aggressive as before and may not recommend downsizing the VM.
b. Since the Memory|Workload % metric is calculated based on memory utilization, it will show much higher values that Memory|Usage%. So if some management packs have defined alerts on Memory|Workload% metric, these alerts may remain triggered.
I have to thanks to Hovhannes Antonyan and Sunny Dua for providing much of the context for this blog article.
Dashboard 101 how to create a simple dashboard and apply interactions.
Views are basic building blocks for vROps reports and dashboards. My next blog will show how to use multiple views in a dashboard.
Audio File below
A quick introduction to vROps 6.7
Audio Download:
